|
|
The American Bar Association
| ||||||||||||||||||||||||||||||||||||||||||||||||||||||||||||||||||||||||||||||||||||||||||||||||||||||||||||||||||||||||||||||||||||||||||||||||||||||||||||||||||||||||||||||||||||||||||||||||||||||
| Table 1 Legal needs in low income households |
||
| Kind of Need (note 8) | Incidence | Prevalence |
| Housing and real property | 16% |
16% |
| Personal finances and consumer | 16% |
16% |
| Community and regional | 9% |
12% |
| Family and domestic | 18% |
20% |
| Employment-related | 9% |
8% |
| Personal and economic injury | 8% |
7% |
| Health and health related | 6% |
6% |
| Wills/Estates/Advance directives | 5% |
5% |
| Public benefits problems | 4% |
4% |
| Small business and farm issues | 3% |
2% |
| Children’s schooling | 3% |
2% |
| Other civil rights/liberties | 1% |
1% |
| Vocational training-related | <1% |
<1% |
| Discrimination-ADA related | <1% |
<1% |
| Legal needs of immigrants and speakers of other languages | <1% |
<1% |
| Problems of Native Americans | <1% |
<1% |
| Military and veterans issues | <1% |
<1% |
These findings are similar to those from other surveys, with two exceptions:
The legal needs of moderate income families were strikingly similar to those of low income families. Moderate income families reported significantly more needs for only three categories: employment; personal and economic injury; and wills estates and personal directives. Low income households reported significantly more needs only in the public benefits category (note 10).
The households with the most legal needs were clustered just below, and just above, 125% of poverty (note 11).
Low Income Households: Response to Legal Needs
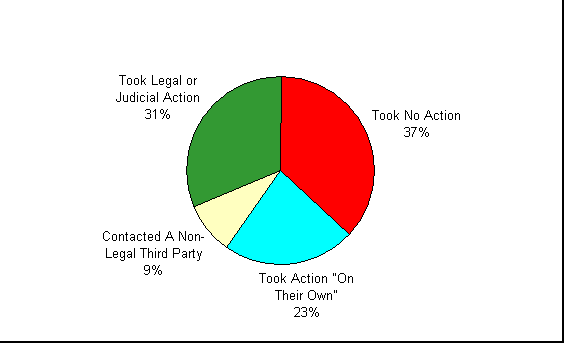
Chart 2 shows the ways low income households with legal needs respond to legal needs.
Chart 2: Low Income Households: Response to Legal Needs

When confronted by a legal need, low income households are more likely to do nothing than moderate income households: 37% of low income households reported they "did nothing at all" vs. 26% of moderate income households. Clearly, any system which aims to deal with the entire need must first persuade a very substantial number of people who now do nothing to take some kind of action.
Satisfaction with Result ObtainedTable 2 shows low income households’ satisfaction with the results obtained by their response to a legal need (note 12):
| Table 2 Low income legal needs Satisfaction with outcomes of response to legal needs |
||
Action Taken |
Satisfied with |
Dissatisfied with Outcome (note 13) |
| Legal/judicial action | 48% |
40% |
| Contacted non-legal third party | 46% |
49% |
| Attempted to handle on own | 36% |
61% |
| Did nothing at all | 29% |
58% |
Table 3 shows the same information, but by type of legal need (note 14):
| Table 3 Low income legal needs Satisfaction with outcomes of response to legal needs |
||
| Legal Need | Satisfied with Outcome |
Dissatisfied with Outcome |
| All needs | 38% | 53% |
| Housing/real property | 41% |
55% |
| Personal finance/consumer | 46% |
48% |
| Community/regional | 22% |
71% |
| Family/domestic | 45% |
46% |
| Employment related | 29% |
67% |
| Personal/economic injury | 52% |
45% |
| Health/health care | 22% |
64% |
| Wills/Estates/Adv. Direct. (note 15) | 44-64% |
15-32% |
The highest rates of dissatisfaction were in community/regional: 71%; employment related: 67%; and health/health care: 64%. Three of the categories with the highest rates of satisfaction are family/domestic; personal/economic injury; and wills/estates. As will be seen in Table 9, low income households with these needs are the most likely to have the assistance of a lawyer.
Table 4 shows the reasons low income households were dissatisfied with the outcome of their actions (note 16).
| Table 4 Low income legal needs: Reasons for dissatisfaction with outcome of responseto legal needs |
|
| Dissatisfied with outcome | 53% |
| Situation unchanged and not happy about it | 25% |
| Need unmet or case lost | 15% |
| Reached unsatisfactory compromise | 6% |
| Situation has worsened | 3% |
| Other | 2% |
Moderate income households were significantly less dissatisfied with the outcomes obtained: 54% were satisfied with the outcome (compared to 38% of low income households) and 38% were dissatisfied (compared to 53% of low income households) (note 17). The differences can be attributed to:
"Unmet need" can be defined in two ways (note 18):
This section provides additional detail on what happens when legal needs of low income people enter the justice system.
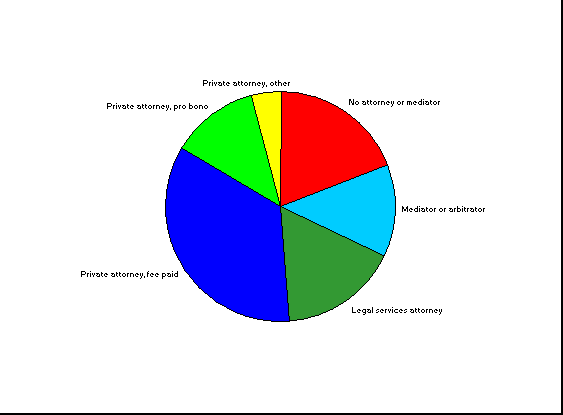
Chart 2 showed that 31% of all legal needs in low income households are taken into the legal/judicial system. As Table 5 shows, 68% of those needs were taken to an attorney (note 19).
| Table 5 Low income legal needs in the legal/judicial system: How needs are handled |
|
| Taken into the legal/judicial system | 100% |
| Assisted by an attorney | 68% |
| Taken to a mediator or arbitrator | 13% |
| Taken to a court or hearing body without an attorney or mediator | 19% |
Legal needs shown as "taken to a court or hearing body without an attorney or mediator" includes some pro se litigants (people who represent themselves in court without an attorney), but the proportion of pro se litigants can not be determined from the ABA Study. It is likely that most of the people in this category simply went to their local courthouse to seek assistance; the vast majority did not receive any help (note 20).
Of the needs taken to attorneys, about three quarters involved a private attorney, and about 25% were handled by a legal services program (note 21).
| Table 6 Legal needs with a lawyer: Type of lawyer |
|
| Private lawyer | 75% |
| Legal Services | 25% |
Most low income households represented by a private attorney pay a fee for legal assistance (note 22).
| Table 7 Legal needs with a private lawyer: Fee arrangement |
|
| Agrees to represent | 100% |
| Paid fee | 68% |
| Usual fee | 39% |
| Reduced fee | 8% |
| Not sure if usual or reduced | 8% |
| No fee | 32% |
| Contingent fee but lost | 7% |
| Pro bono assistance (note 23) | 25% |
Chart 3 shows the information in Tables 5 through 7 in graphical form.
Chart 3: Low income legal needs in the legal/judicial system

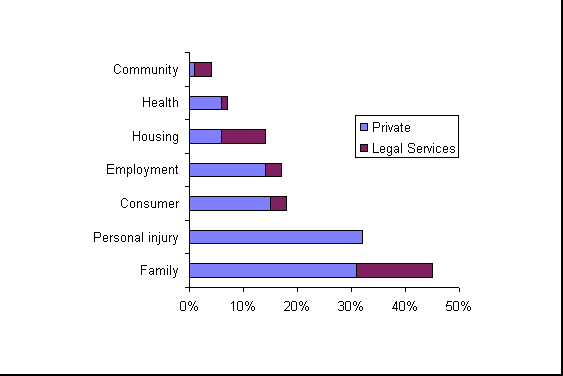
Table 8 shows the distribution of attorneys by category of legal need (note 24). (In all categories not shown, less than 1% of legal needs have a lawyer).
| Table 8 Kind of attorney by category of need |
||
| Legal Need | All needs with private attorney |
All needs with legal services attorney |
| Housing/real property | 6% |
8% |
| Personal finance/consumer | 15% |
3% |
| Community/regional | 1% |
3% |
| Family/domestic | 31% |
14% |
| Employment related | 14% |
3% |
| Personal/economic injury | 32% |
* |
| Health/health care | 6% |
1% |
| * Not statistically significant but more than 1%. | ||
Chart 4 summarizes the information in Table 8.
Chart 4: Percent of all legal needs with a lawyer

Chart 4 confirms what many have long suspected—low income households use attorneys in the same way as others: for family matters, for personal injury, and for wills and estates (which is not shown on the chart, but ranks third in frequency of use of attorneys).
The fact the private attorneys handle about three times more legal needs than legal services attorneys is the most surprising finding in the ABA study. Actually, a little analysis shows that this situation is not at all surprising. Consider the kinds of needs that low income households most often take to attorneys: family/domestic, personal/economic injury, and wills and estates. Personal/economic injury are fee generating cases that cannot be handled by legal services attorneys. Because of the very high demand for family/domestic assistance, legal services programs generally restrict representation to situations in which abuse has occurred. And many legal services programs do not handle wills and estates.
Second, consider how low income persons made contact with their private attorney:
| Table 9 Legal needs with private attorneys (note 25) |
|
| How made contact: | |
| Already knew advocate | 37% |
| Referred by a friend | 37% |
| All other (yellow pages, ad, lawyer referral service, pre-paid plan, etc.) | 26% |
In essence, nearly three-quarters of low income people with an attorney obtain those services because they knew the attorney, or because they have a friend who knew an attorney. This also helps explain the large amount of pro bono assistance provided by private attorneys (see Table 7).
Overview of Survey Findings1. The US Census Bureau determines the official rate of poverty ("100% of poverty") each year.
2. For full information on the methods used to select and adjust the sample, see the Appendices of Low-Income Legal Needs and Moderate Income Legal Needs.
3. Low Income Legal Needs, Table 4-1, page 19.
4. Incidence rates are used to project future demand for legal services.
5. Low Income Legal Needs, Table 4-2, page 19.
6. Moderate Income Legal Needs, Table 4-2, page 19.
7. Adapted from Low Income Legal Needs, Table 4-3, page 21. The percentages shown differ slightly from those in the ABA reports. The ABA reports track "legal situations"—the occurrence of a legal need in a low income household. Some legal situations, such as a marital dispute, generate two legal needs. This document shows legal needs, rather than legal situations.
8. See Appendix E, "Glossary" in Low-Income Legal Needs for a list of the specific issues in each category
9. The survey first determined if the respondent received any of 7 public benefits (Social Security or SSI; Medicare; Medicaid; "welfare for families or individuals"; Food Stamps; or "any other government-administered benefit program". If the respondent answered that the household receive one or more benefits, he or she was then asked whether the household had experienced any problems applying for, getting, or keeping a benefit; been required to pay back money; been denied information to challenge a ruling or been unable to get a hearing; been treated unfairly in a hearing; or experienced "other serious difficult[ies]".
10. For a chart comparing the prevalence of legal needs in low and moderate income households, see Agenda for Access, Chart 6, page 23.
11. For a discussion of the needs of groups just below and above the 125% limit, see Agenda for Access, page 24.
12. Low-Income Needs, p. 58. Does not add to 100% because "Can’t say/pending" data omitted from table.
13. Column does not add to 100% because some households responded in more than one way.
14. Ibid.
15. A range rather than a specific figure is shown because the sample for this legal need was too small to permit use of a single statistic. The range shows the "95% confidence level"; that is, there is a 95% probability that the number of satisfied people falls somewhere between 44% and 64% of all people who did something related to wills, estates or advanced directives.
16. Low-Income Needs, p. 59.
17. See Moderate Income Legal Needs, Table 5-14, page 56.
18. For a more complete discussion of unmet need, see Agenda for Access, page 6.
19. Low Income Needs, p. 52.
20. From Lonnie Powers, who served as an advisor to the ABA Consortium during analysis of the data. Lonnie was very clear that only a small part of the 19% shown in the table are pro se litigants.
21. Agenda for Access, p. 26.
22. Low Income Needs, Table 5-12, page 56.
23. If situations in which a private attorney provides free initial consultation but does not agree to take the case are included, then the percentage of pro bono is 48%.
24. Total needs from Comprehensive Findings, p. 20. Needs with a private or legal services attorney, from Agenda for Access, p.27.
25. Low Income Needs, p. 55.
|
Copyright © 1998. We encourage non-profit organizations to reproduce material on this
site. Please send us an e-mail describing how you will use what you have reproduced.
Profit-making organizations: contact us before reproducing
anything in this site. |